Talking Macros: Credit growth & PMI
Strong Indian economic indicators justify all-time highs on Nifty 50
In today's post, I'll be delving into the world of two key macroeconomic indicators that hold a special place in my analysis. These indicators are not only my favorites but are also considered among the most crucial in the economic landscape. I'll be sharing insights on why the markets could be on an upward trajectory, anchored by the enduring strength of India's structural economic story. Let's take a closer look at the graphs to uncover the rationale behind the potential for market growth.
The 2 indicators are: Credit Growth & PMI (Purchasing Manager's Index)
Note: If my emails end up in the ‘promotions’ tab, please move them to inbox so you don’t miss out. Don’t forget to subscribe and join 500+ readers!
1. Credit Growth
Last year in November 2022, I wrote another blog: ‘Golden Era of Indian Banking System: Bank Nifty in expansion mode?’ where I discussed how things are shaping for Indian banks, with credit growth inching up and NPAs going down. The rate of growth over the last few months had fallen from ~18%YoY then, to ~15%YoY as of last month (which has again started to inch up at 16% for July). Historically, the credit growth rate in a country tends to be equal to the nominal growth rate of an economy. So let’s assume India’s real GDP grows at 7% and inflation is around 5%, the sustainable long term credit growth in the country shall be equal to ~12%.
In India’s case, financing is underpenetrated. India’s per capita debt levels are amongst the lowest in the world amongst large economies. ‘Household debt/GDP in India is just 19% against 48% for China’ - Morgan Stanley in its latest bullish report on India. When it comes to financing, RBI divides the gross loan book of the Indian banks/NBFCs into 4 parts: Agriculture, Industry, Services, and Personal Loans. Out of these 4, the one which has drawn maximum attention due to the highest growth rates in many recent years is the ‘Personal Loans’ category, growing today at ~21% YoY. The proportion of the Personal loans category as part of the total loan book of the country has grown from 23% to ~30% today, just in the span of the last 6 to 8 years. It includes loans taken for buying houses, automobiles, consumer durables, gold loans, education loans, and more. Here is how various sub-segments in this category are growing: (source: RBI)
The biggest chunk of personal loans is housing loans, which constitute ~50% of the total personal loan book of the country, growing at 15%.
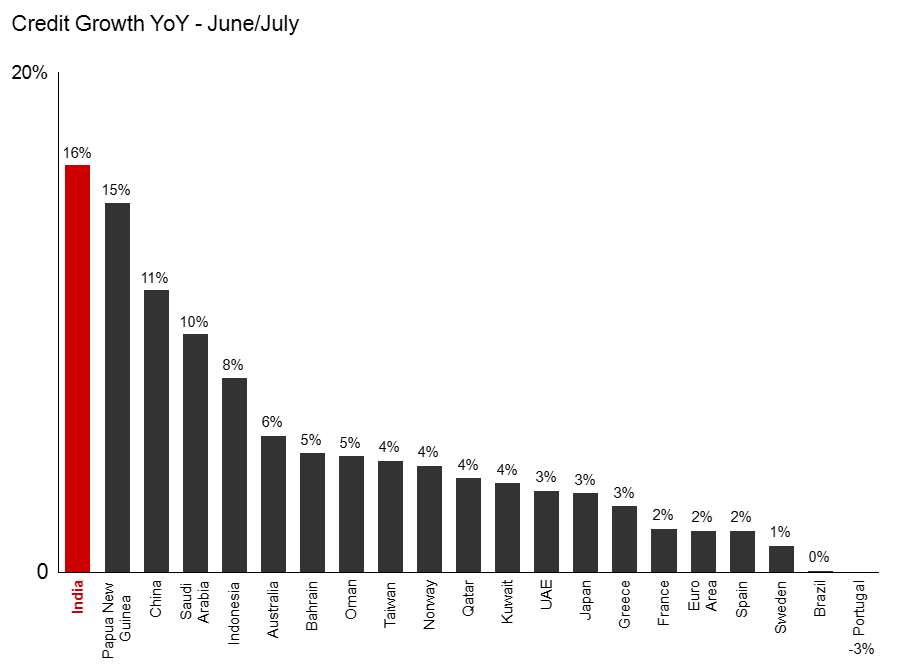
Credit plays a crucial role in stimulating the economy, as it has a multiplier effect that encourages businesses to expand, invest, and create jobs. In a global context, India's credit growth rates surpass those of other developing countries and outperform developed markets like the Eurozone as shown in graph below: (source- Tradingeconomics)
Even though India is at the top, the bigger question is, can we go higher than 16%? something I think is very much possible. India's investment cycle is just beginning, driven by infrastructure projects (evidenced by outstanding results from major infrastructure company L&T) and real estate developments. During the previous boom cycle of 2003-2007, India's credit growth averaged around 25% and peaked at over 35%. Although the current base is significantly larger, I personally think a credit growth rate of around 20% YoY for the coming 1-2 years is feasible.
2. Purchasing Manager’s Index (PMI)
PMI is a much-followed index globally but is rarely taught in classroom economics. Where many indicators are published with a lag, the PMI comes out in the first few days of each month, thus effectively acting as a leading indicator. It’s mainly calculated for 2 sectors: Manufacturing and Services; based on data collected by IHS Markit (now part of S&P Global). Based on survey responses from business managers in manufacturing and services, a reading above 50 means expansion, and below 50 means contraction. PMI has a high degree of correlation with the business cycle and has successfully acted as a strong leading indicator (excerpt taken from Ankita Pathak’s latest book: The Macro Faire).
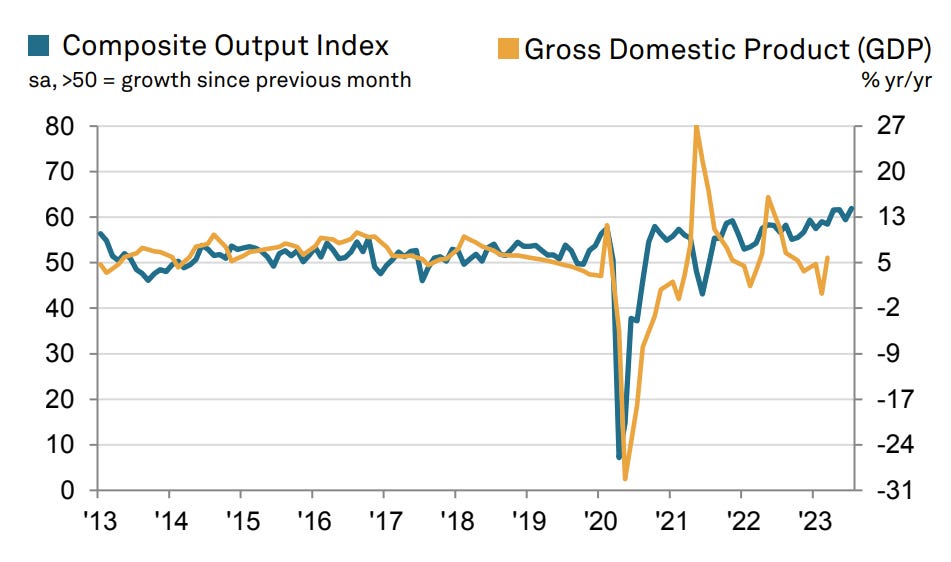
Now let’s see how India’s composite PMI (which is a weighted average of headline services and manufacturing output index) has panned out in the last 10 years:
^(Source: S&P Global). During several years from 2013 to 2019, the readings have fluctuated between the 48-55 range in the past, but in 2023, they have surged to around 60 levels. This is remarkable considering the current global economic context where the world is on the brink of a mild depression. Even more impressive is that the indicator is continuing to trend higher, as shown in the graph. Although the PMI has its drawbacks in terms of the survey sampling methodology, it is essential to view this in a global context to understand where India stands:
^This graph from Tradingeconomics comparing India's services PMI with the world confirms the country's exceptional performance. India seems to be outperforming other countries by a significant margin in terms of services PMI, which tracks the momentum of India's service sector—the largest component of India's GDP. The recovery in global markets has boosted demand for IT and Global capabilities centers (GCCs) in India, and the presence of 50% of global GCCs in India, supported by strong demographics, has contributed to the high PMI readings. Many of these GCCs were established post-Covid, as the world realized that work could be efficiently conducted online, leading to off-shoring back-office and research-based tasks to India due to its cost advantages and low employee costs. In a way, the economic impact of Covid-19 turned out to be advantageous for India.
To summarize today’s blog, I took 2 economic indicators which I believe are amongst the most important indicators for people tracking macros globally and tried to showcase how India today stands out by a huge margin when seen in the global context. A word of caution, economics involves lots of subjectivity. The same indicators which I see as bullish might be bearish for someone else. Before publishing this blog when I had a discussion with my fellow mates about credit growth, they did point out correctly that such high growth in credit can lead to bubble formations over time. No one is wrong, it’s all about perspective.
I hope you enjoyed reading, support me by sharing with your friends and help me reach more potential readers!
See you in the next blog!


